
Recruitment Analytics Software That Shows You Exactly Where Hiring Breaks, Before Someone Asks Why
Our recruitment analytics software answers the question before your CFO asks it. Time-to-hire, cost-per-hire, source effectiveness, and where candidates drop off, tracked automatically and reported the way each stakeholder wants to see it.
Trusted by 50+ companies.
4.8/5 rating








What Recruitment Analytics Software Does
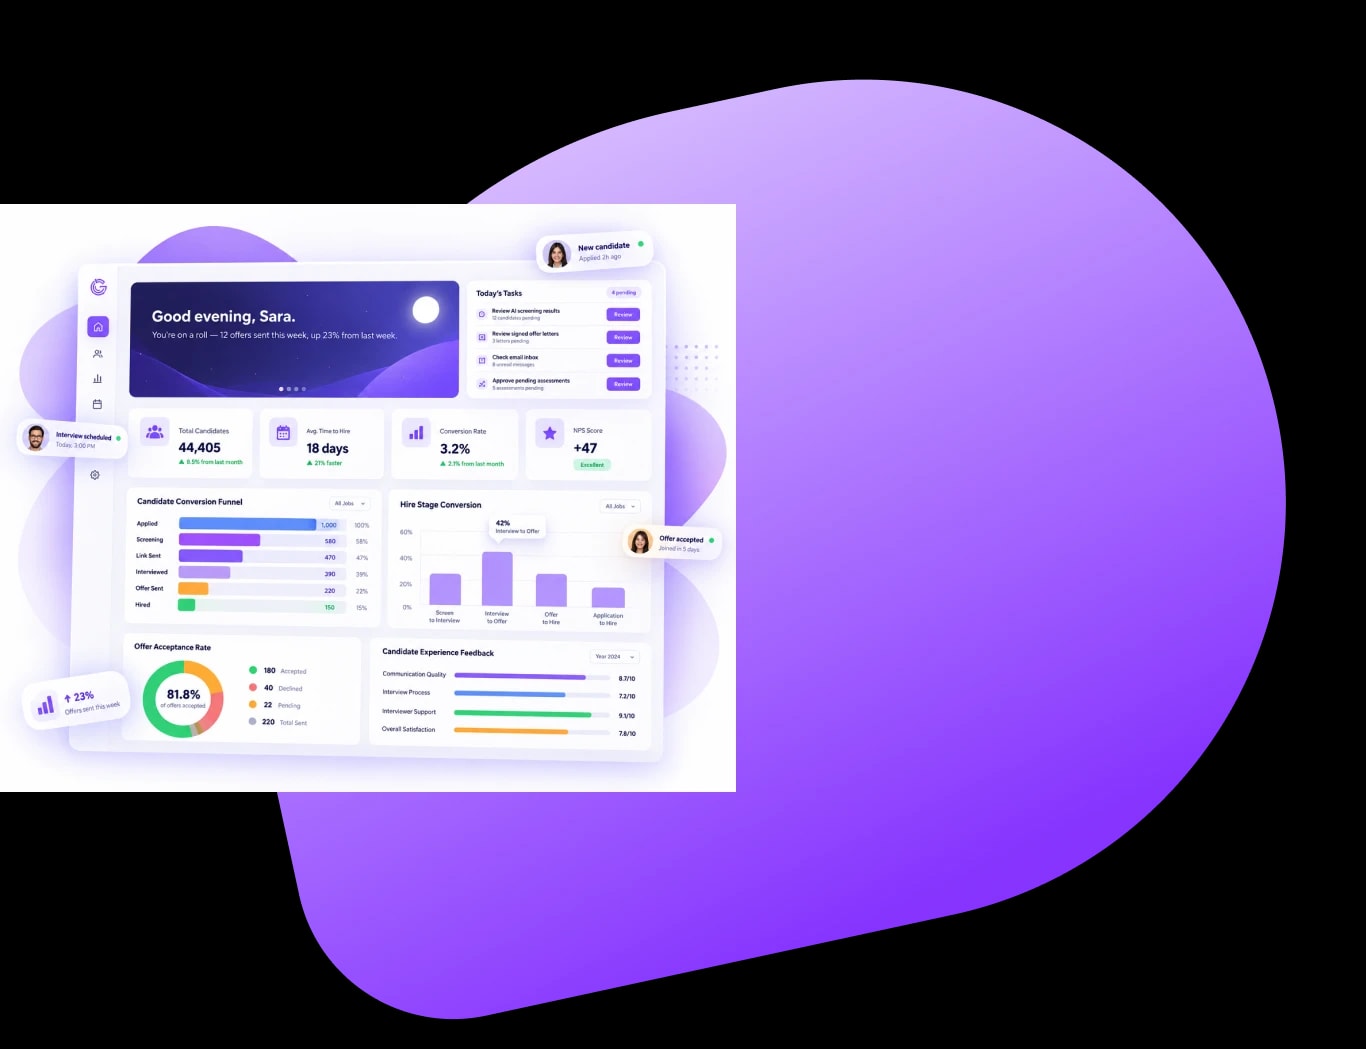
Recruitment analytics software tracks and reports on hiring performance, time-to-hire, cost-per-hire, source effectiveness, and where candidates drop off, instead of a recruiter manually pulling numbers into a spreadsheet after the fact. Getgeek is AI recruiting software whose analytics update automatically as candidates move through the pipeline, and can be filtered by role, department, or time period, then exported into whatever report a specific stakeholder actually needs.
Hiring performance — last 6 months
Time-to-hire
26
days
18% vs six months ago
Cost-per-hire
$2,140
11% vs six months ago
Offer acceptance
87%
5 pts vs six months ago
Time-to-hire trend (days)
See it, don't just read about it
What a Getgeek Dashboard Actually Shows
Numbers on a features page are easy to skim past. A dashboard isn't. The example above shows the shape of what a hiring team actually sees: headline metrics at a glance, and a trend line underneath showing whether things are getting better, or quietly getting worse before anyone notices.
See your own numbers, not an example.
Bring your current hiring data to a live call and see it inside a Getgeek dashboard.
Vanity metrics vs. real ones
The Sources That Look Good and the Sources That Actually Work
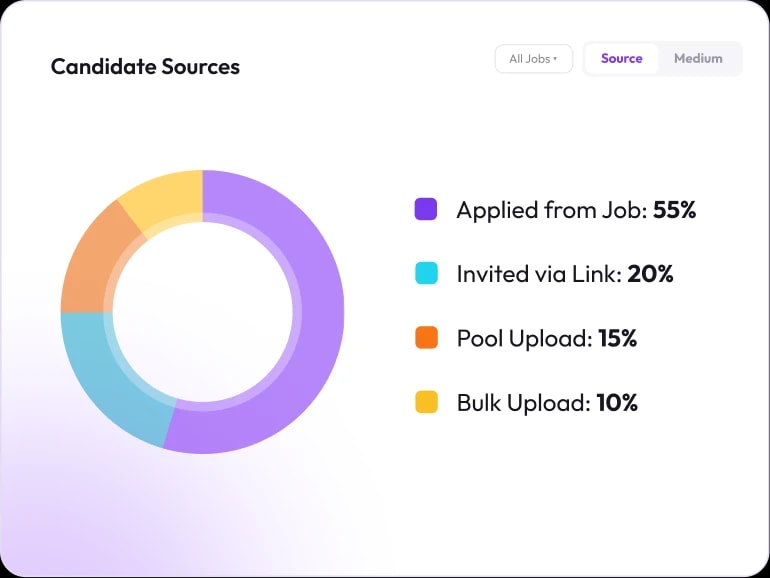
A job board that sends 400 applicants looks better than one that sends 40, right up until someone checks how many of each actually got hired. Application count is the easiest number to celebrate and the least useful one to act on.
Getgeek's source effectiveness tracking is real recruiting data analytics, not vanity metrics. It follows a candidate all the way from where they came from to whether they were hired, not just whether they clicked apply. That's usually the moment a recruiting budget gets reallocated, once volume and quality stop being treated as the same thing.
The same data, different audiences
One Number for Recruiting, Five Different Reports for Everyone Else
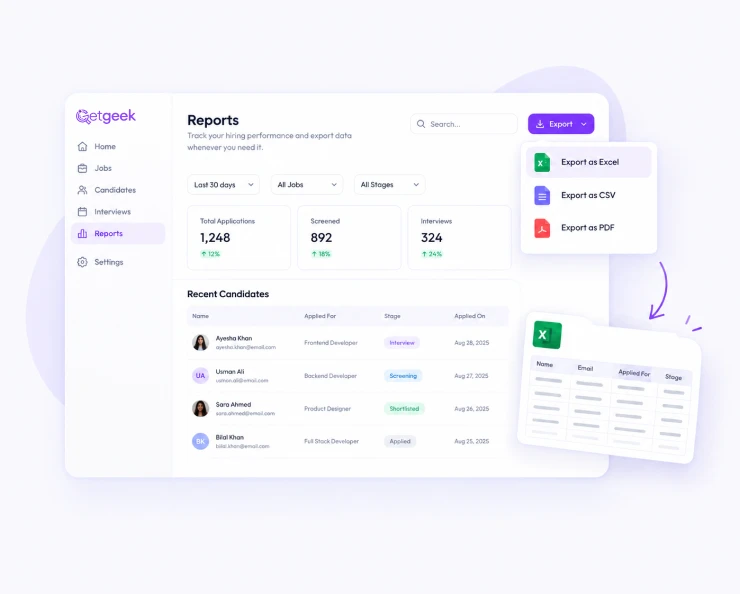
A recruiter wants to know where candidates are stuck. A hiring manager wants to know when their role will be filled. Finance wants cost-per-hire in a format that matches the budget spreadsheet. Leadership wants one slide, not a recruiting dashboard tour.
None of those people are wrong to want something different, and none of them should have to ask a recruiter to rebuild the same numbers four separate times. The same underlying data, filtered and exported differently, answers all four questions without anyone re-entering anything.
Stop rebuilding the same report four times.
Bring a recent stakeholder request to a call and see how one dashboard answers all of them.
Connected, not separate
Why Your Funnel and Your Dashboard Are the Same Conversation
Every metric on this page describes a moment in a candidate's path from application to hire. Time-to-hire is the whole funnel end to end. Score effectiveness is the top of it. Drop-off rate is the gap between two stages that a dashboard makes visible instead of anecdotal.
If the idea of a recruitment funnel is new, or you want the fuller picture of where candidates typically get lost and why, that's covered in depth in Getgeek's guide to the recruitment funnel. Pair this with Compass, Getgeek's analytics and strategy agent, for forecasting built on top of the same numbers you're already looking at here.
The toolkit
Everything Included in Analytics & Reporting
01
Recruiting Analytics
Time-to-hire, cost-per-hire, and source effectiveness, broken down by role and department. This is recruiting analytics software built for the questions people actually ask, not just the ones that are easy to answer.
02
Custom Reports
This recruitment reporting software builds and exports a report for any metric, filtered however a specific audience actually needs it, not however the tool happens to format it.
03
Source Effectiveness
See which channels actually deliver candidates who get hired, not just the most applicants.
04
Diversity Hiring Metrics
Track diversity data across the hiring funnel to support your organization's recordkeeping needs.
05
Trend Tracking
Watch a metric move on your hiring metrics dashboard over time, not just its value on a given day that tells you nothing about which direction you're actually headed.
06
Stage-by-Stage Drop-Off
This recruiting KPI dashboard shows exactly where candidates are lost between application and hire, not just a final count that hides where it actually happened.
Analytics & Reporting: FAQs
What is recruitment analytics software?
Recruitment analytics software tracks and reports on hiring performance, time-to-hire, cost-per-hire, source effectiveness, and where candidates drop off, instead of a recruiter manually pulling numbers together after the fact.
Does Getgeek's analytics update automatically?
Yes. Metrics update as candidates move through the pipeline, rather than requiring a manual pull or export to see current numbers.
Can I filter analytics by role or department?
Yes. Reports can be filtered by role, department, or time period, so the numbers match the question actually being asked.
How does source effectiveness tracking work?
Source effectiveness follows a candidate from where they applied through to whether they were hired, so a channel can be judged on hire quality, not just application volume.
Can different teams get different reports from the same data?
Yes. The same underlying data can be filtered and exported differently for recruiters, hiring managers, finance, or leadership, without rebuilding the numbers each time.
What does diversity hiring tracking cover?
Diversity data is tracked across the hiring funnel to support an organization's own recordkeeping needs.
See Where Your Hiring Process Actually Breaks
Bring your current hiring data to the call. We'll show you what it looks like inside a real dashboard, not a mockup, so you can see exactly where time and candidates are being lost.
Book a Demo
Automate your company's hiring pipeline and deploy custom end-to-end AI solutions that deliver proven candidate matching.
Help
Platforms
Getgeek Job BoardSubscribe to newsletter
Call Us
(+92) 323-0295713
Email Us
contact@getgeek.ai